Dr. Hupy has been displaying to us that the applications for UAS are expanding daily. The utilization of UAS to calculate the volume of stock piles in aggregate mining operations is one of the new application Dr. Hupy has been exploring. Calculating the volume of piles with UAS is more effective in both time and cost. Reducing the cost of could result in higher frequency of stock pile assessments and/or an overall cost savings for the business. Throughout this lab I will be calculating the volume for 3 different stockpiles using 3 different methods. I will then compare the results between the 3 different methods.
Methods
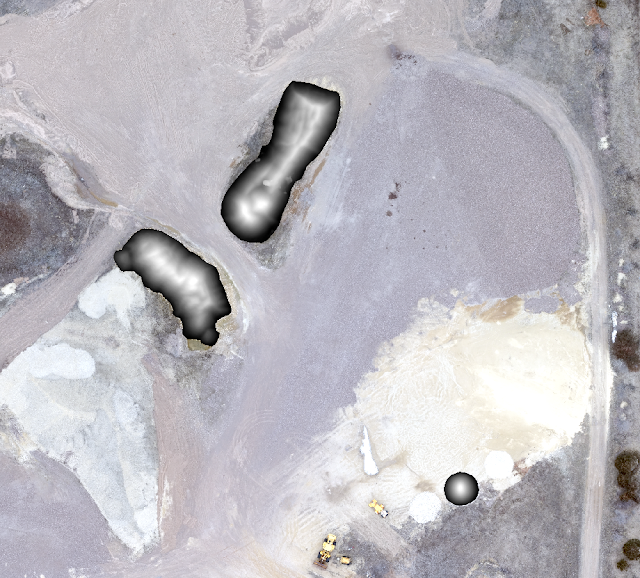
Per the instruction of my lab assignment i will be calculating the volume of 3 different aggregate piles at the Litchfield mine site using 3 various methods. The first method will utilize the volume tool in Pix4D which I have used previously. I will utilize ArcMap to calculate a raster volume first, and then calculate the volume of a Triangulated Irregular Network (TIN). I will use the mission from the Litchfield Mine which was collected with 24 megapixels and flown at a 200 foot elevation from our class held on 3/13/2016 to select my piles from and calculate the volume (Fig. 1).
 |
| (Fig. 1) Display of the three piles I will be analyzing from the Litchfield flight. |
Pix4D
Pix4D has the simplest process to calculate the volume of the piles. I will be utilizing the same method to calculate the volume in Pix4D as I did in my previous blog post. I created 3 separate volume perimeters in Pix4D (Fig.2). Once the adjusted volume was displayed I recorded the value in an Excel spreadsheet.
 |
| (Fig. 2) Volume perimeters created in Pix4D with display window. |
Raster Volume
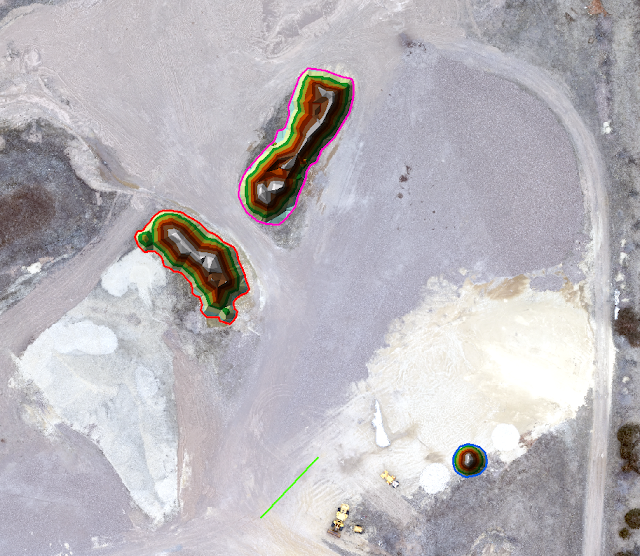
I first had to digitize polygons of the same piles used in the volume calculation Pix4D. I completed the task using the Editor function after opening the mosaic image produced by Pix4D in ArcMap (Fig 3). I then opened the Digital Surface Model (DSM) created by Pix4D in the same data frame of ArcMap. I then utilized the polygon feature to Extract by Mask each area of the piles separately from the DSM (Fig. 4). Using the identify tool I selected pixels at the base of the pile to determine the base height for the pile which I recorded on paper for the next step. The next step was to calculate the surface volume of the pile using the Surface Volume tool in ArcMap. With the Surface Volume window open I set the Input Surface to the clipped DSM image for the first pile, Output Text File was set to my folder, Reference Plane set to ABOVE (as the plane height will be set to the bottom of the pile), Plane Height is set to the dimension I recorded in the previous step (Fig. 5). After selecting OK a text file is created and when opened displays the volume for the pile. The workflow is the same for all 3 piles (Fig. 6).
 |
| (Fig. 3) Digitized polygons of the analyzed piles in ArcMap. |
 |
| (Fig. 4) Extracted polygons of the piles from the DSM image. |
 |
| (Fig. 5) Surface Volume window with parameters set. |
 |
| (Fig. 6) Workflow for calculating the volume of a raster segment (Bomber 2015). |
TIN Volume
First I converted the clipped raster pile sections to a TIN utilizing the Raster to TIN tool in ArcMap. When the TIN is created no information is transfer to the feature. I needed to attach information related to the elevation to the TIN file. I used the Add Surface Information tool to add the z_mean and z_min field to the TIN files of each of the piles. After researching and talking with classmates I determined the z_min field was the one I need to utilize when calculating the volume of the TIN.
I used the Polygon Volume tool to calculate the volume of the TIN's. The parameters of the tool were set to the following: Input Surface was set to the created TIN for pile 1, Input Feature Class was the DSM clipped segment of pile 1, Height Field was set to the z_min from the previous step, Reference Plane was set to ABOVE (again as the reference height was based at the bottom of the pile (z_min)), Volume Field was left as the default of Volume (Fig 7). After running the tool the TIN calculations are automatically added to the ArcMap window (Fig. 8). The workflow was the same for all three of the piles (Fig. 9).
 |
| (Fig. 7) Polygon Volume window with parameters set. |
 |
| (Fig. 8) TIN calculations displayed in ArcMap. |
 |
| (Fig. 9) Workflow for TIN volume calculation (Bomber 2015). |
Results
Looking at the table I created in Excel you can see variation between the methods used for calculation.
Discussion
The first thing to discuss is the variation between the Pix4D results and the Raster/TIN volume done in ArcMap. The polygons used between the two were not exactly the same. I had to draw them separately in both programs thus leading to variations between the results. However, this does not explain the variation in the results between the Raster and the TIN volume as they both utilized the same polygons (sort of) for the calculation. I feel the variation is related to the construction of the TIN polygon. The TIN is created by average elevation by which triangles are created. I believe the average elevation calculation is to blame for the variation as it is an average and is not the true elevation for the entire pile. Additionally, the base level set for the ArcMap calculations was an average of the pile base height and did not take into account the slope of the ground (One side of the base was at a different elevation than other sides). More experimentation is required to determine the best method in calculating the volume of stock piles at aggregate mines.

No comments:
Post a Comment